Work Play About

Beneath the Surface

Industry

  • Data Visualization

Year

2026

Mapping invertebrate diversity in the Smithsonian collection, by ocean depth.

Services

  • D3.js
  • HTML / CSS
  • Python
  • Figma

Brief

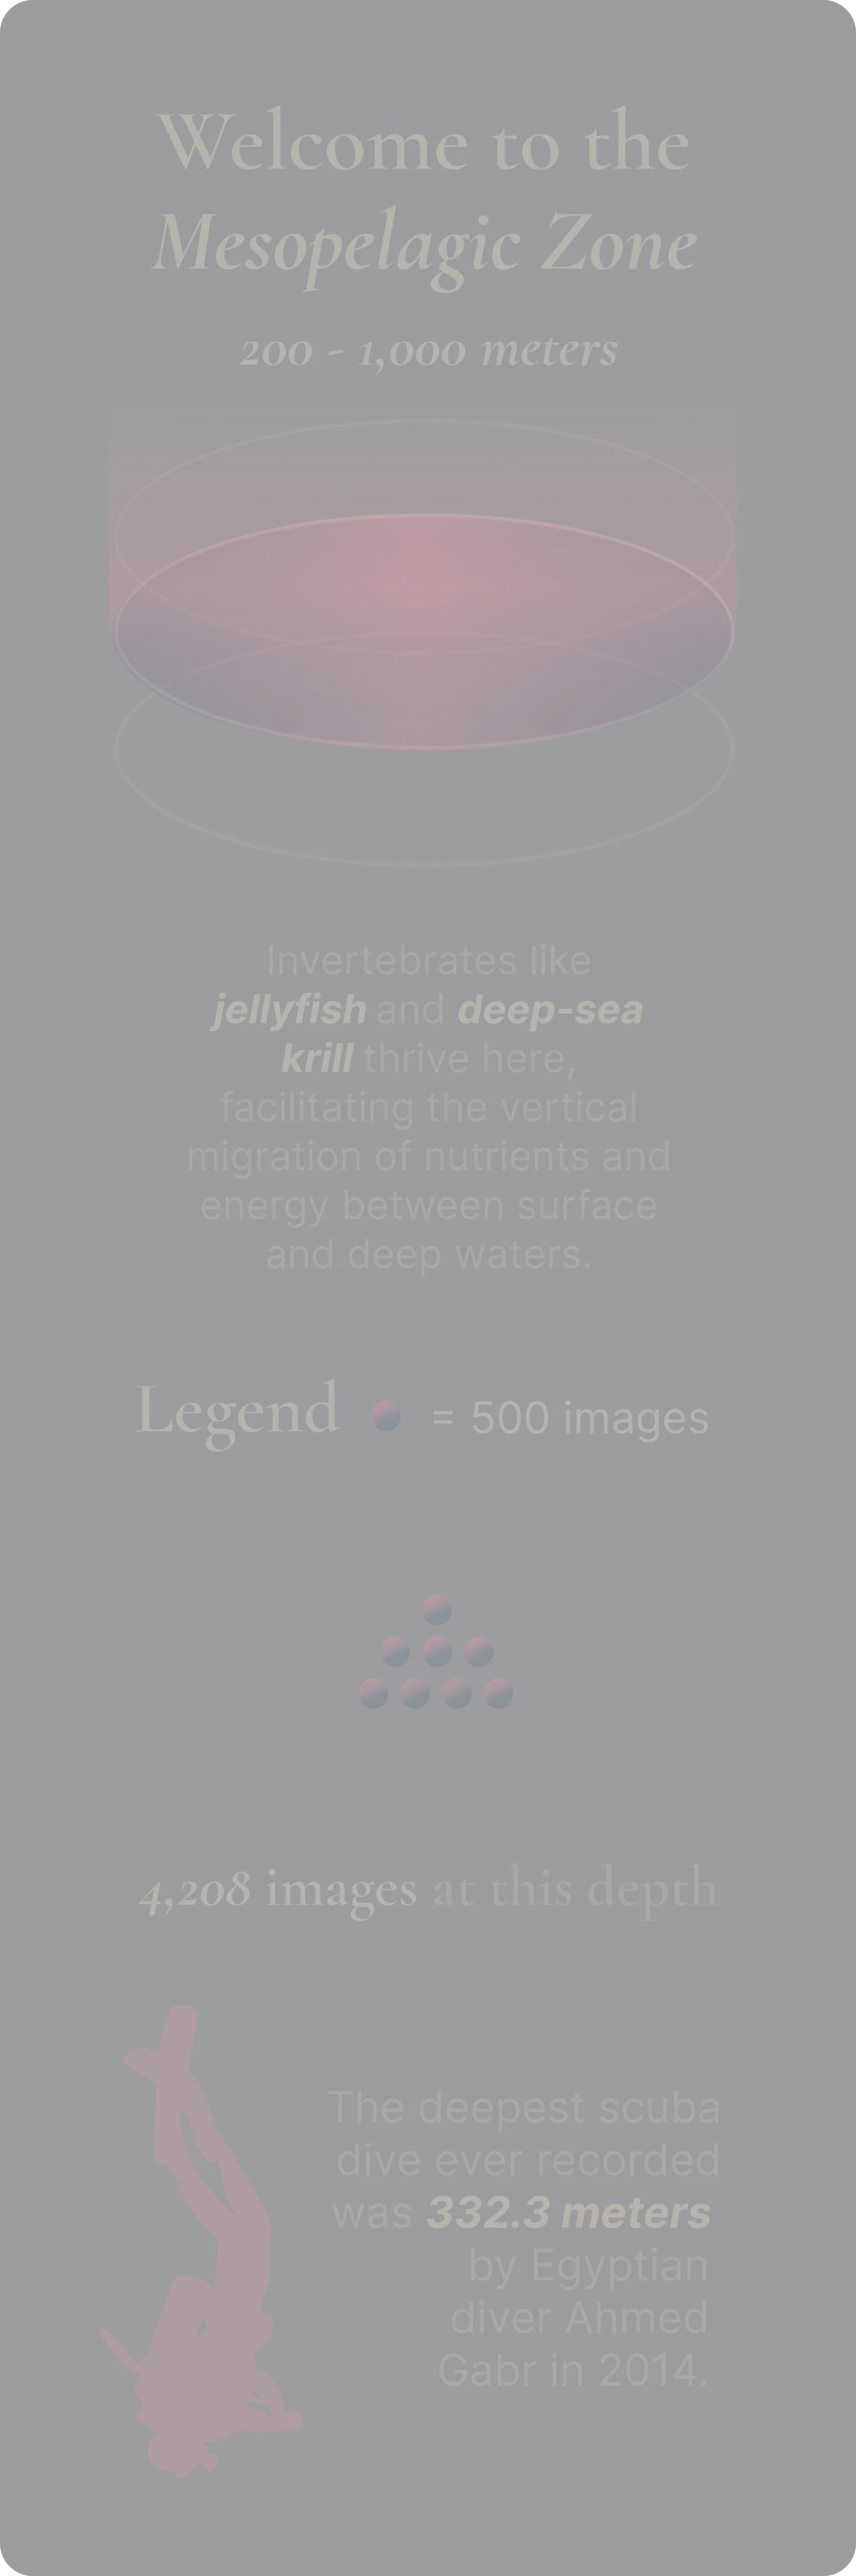
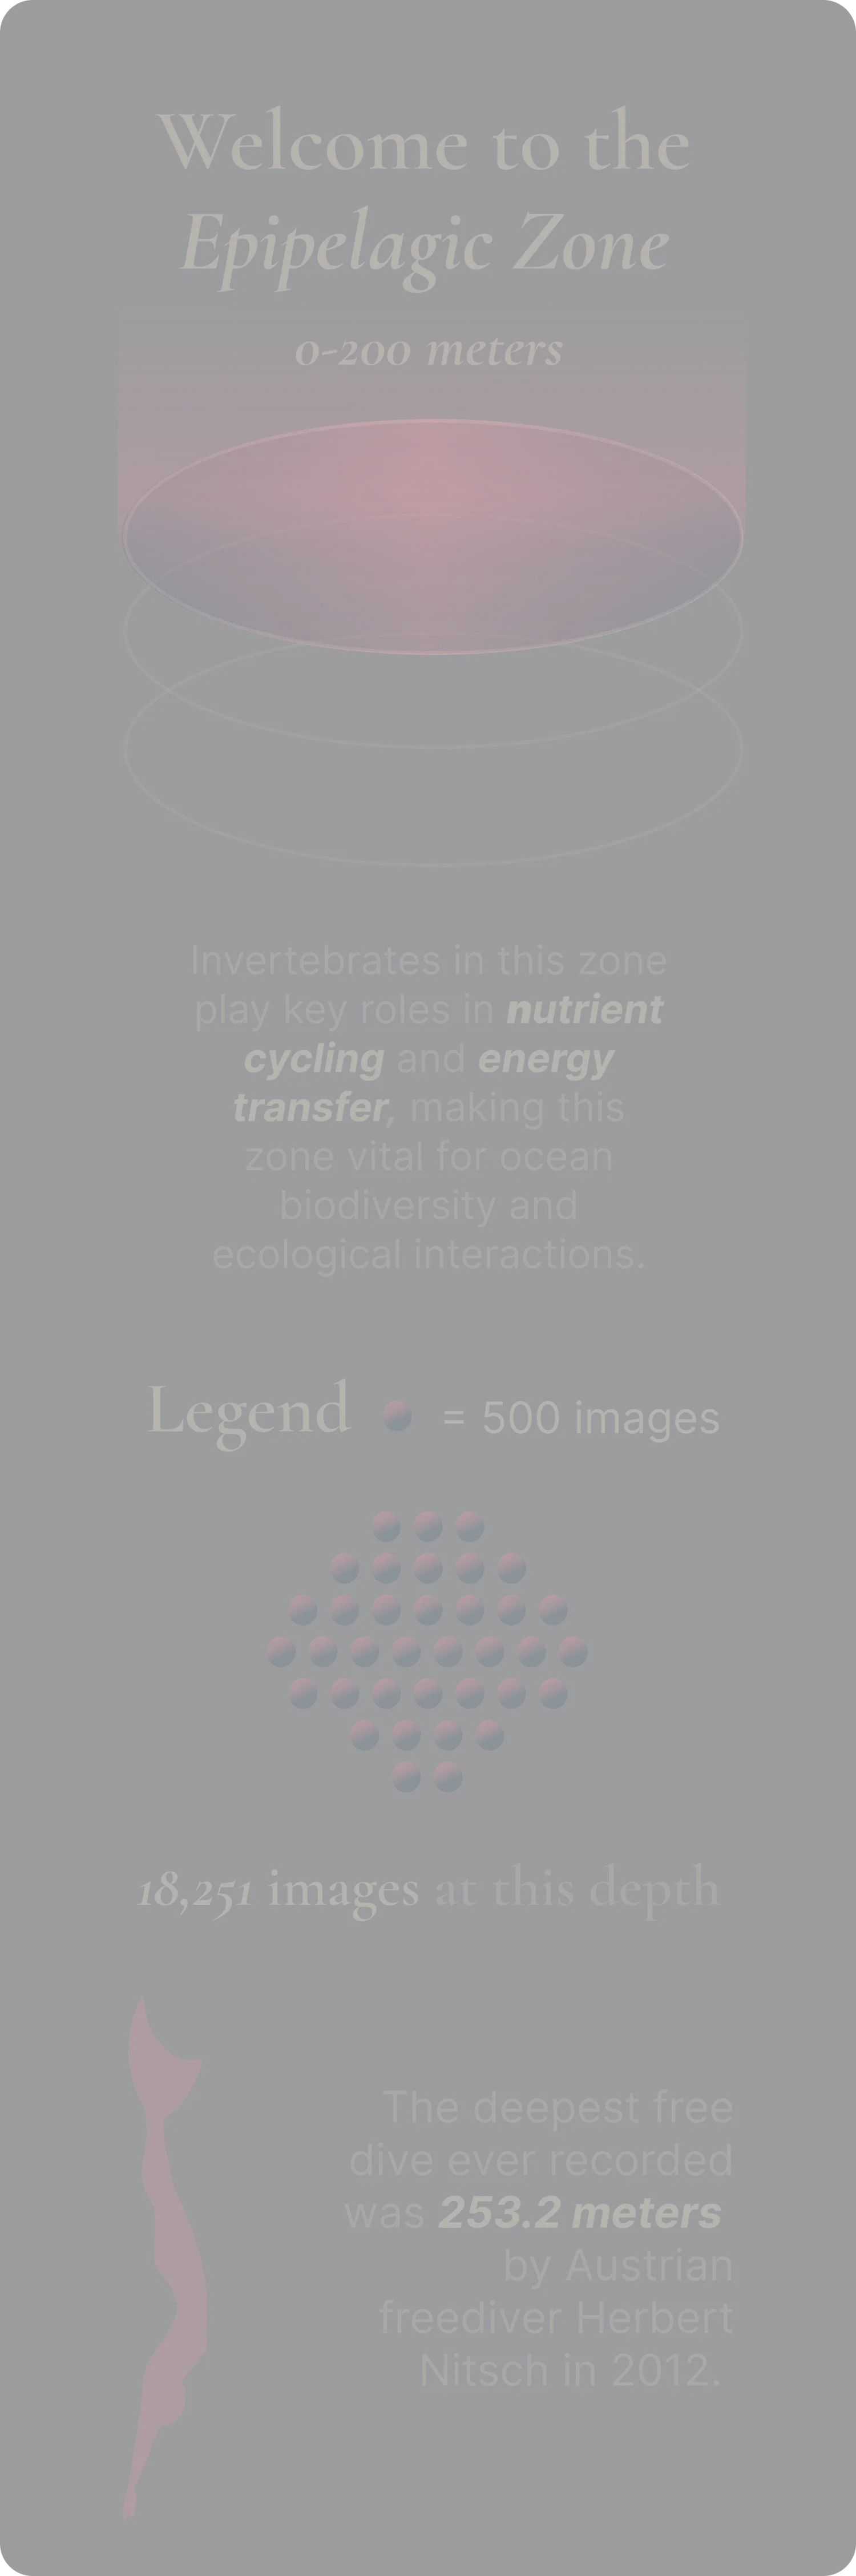
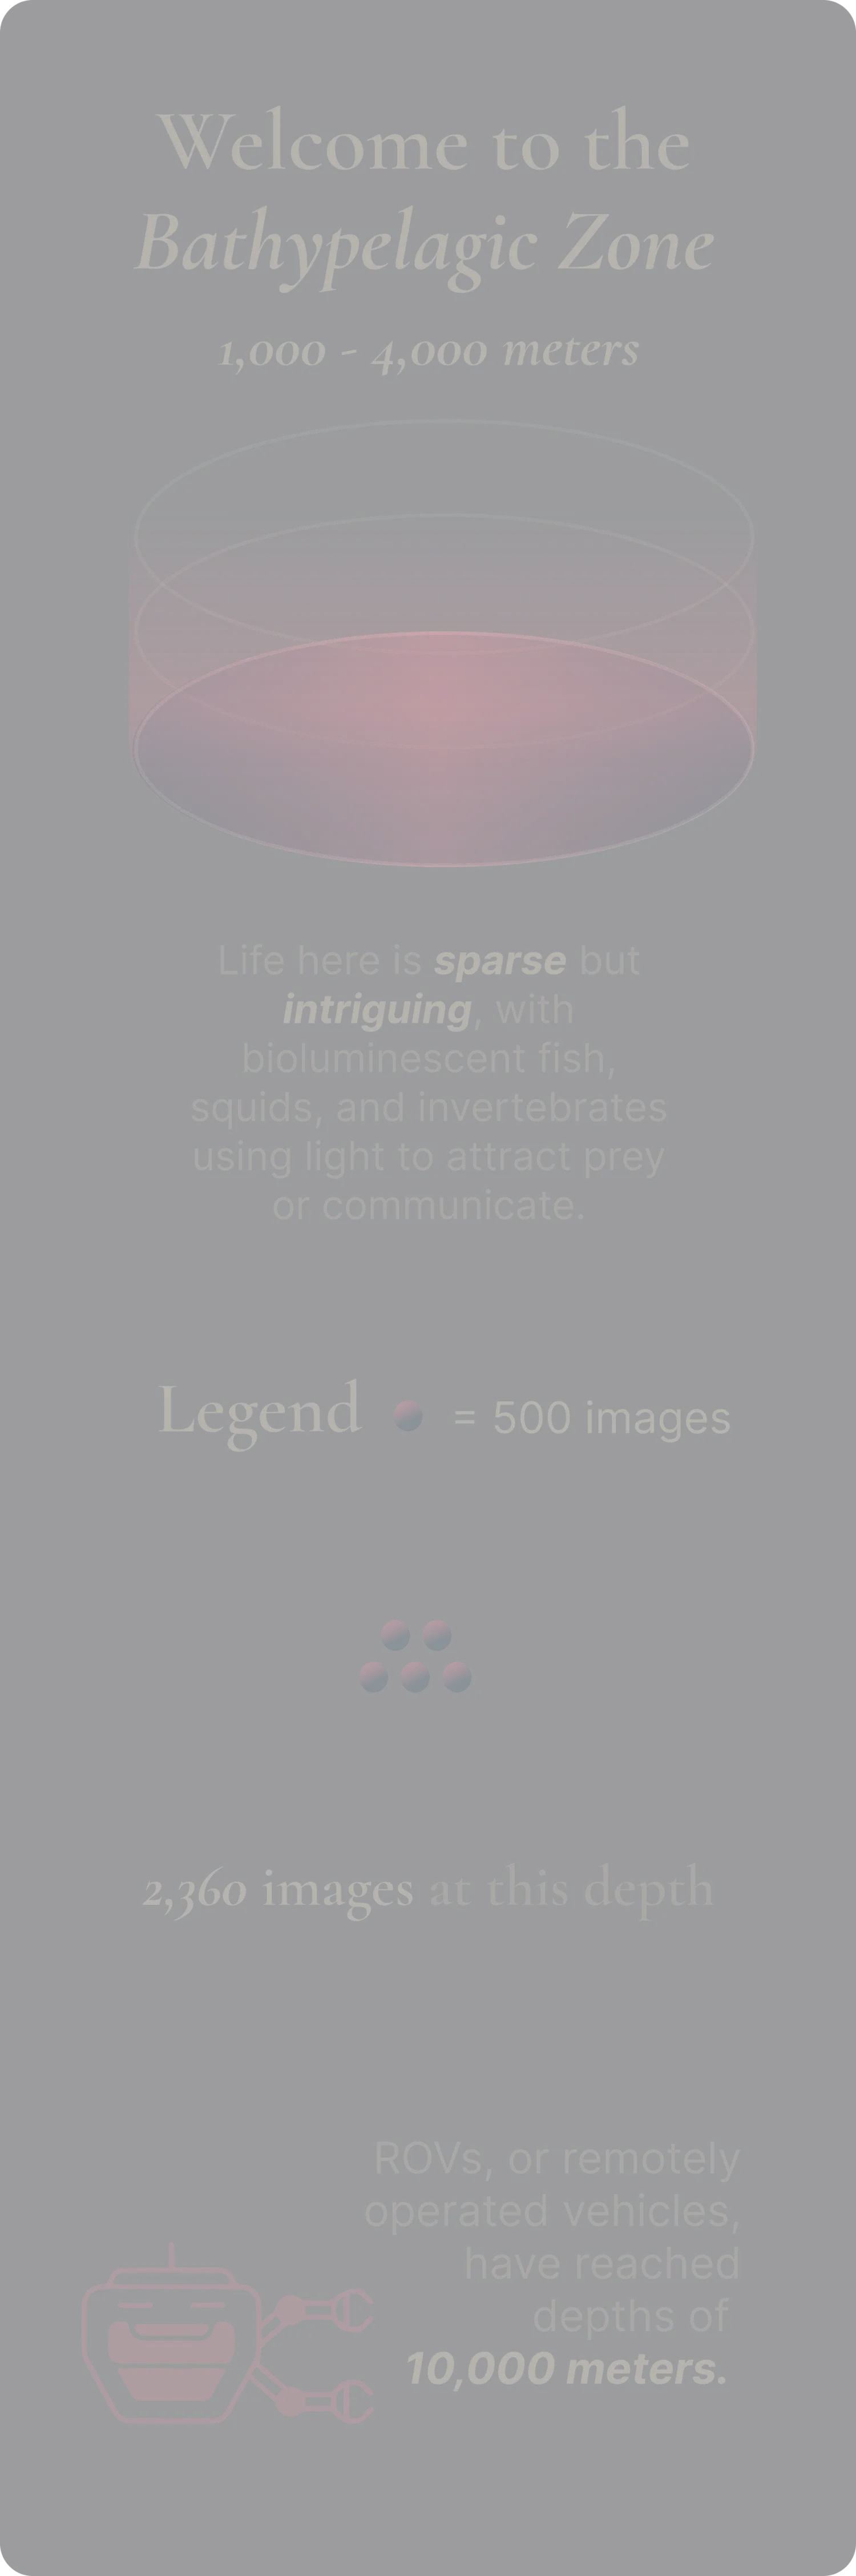
The goal was to find interesting metadata within the Smithsonian Collection and clean it into an engaging, quantitative story. Depth records were binned into three oceanic zones — epipelagic, mesopelagic, and bathypelagic — so each specimen could be grouped by how deep it was collected, with images pulled live through the Smithsonian's own API.

Finding

The color palette was pulled straight from the bioluminescent invertebrates themselves, and the vertical bubble chart is built to evoke the feeling of descending through the water column as the user scrolls. Early testing showed people lost their place mid-scroll, so a floating modal was added as a legend that stays anchored to whichever zone is active.

Detail

A floating legend for wayfinding underwater.

During early prototyping, feedback surfaced that users lost their visual anchor while scrolling — they'd forget which depth they were looking at as the page moved. The fix was a floating modal that acts as a legend, staying with the user as they descend through each zone, color-keyed to the same bioluminescent palette as the specimens themselves.

Epipelagic zone specimen card, Gastropoda

Epipelagic Zone

The sunlight zone, 0–200 meters. The widest range of visible invertebrate life in the collection — including this Gastropoda specimen.

Mesopelagic zone specimen card, Hyalocylis striata

Mesopelagic Zone

The twilight zone, 200–1,000 meters. Light fades fast here — Hyalocylis striata is one of the collection's finds at this depth.
Bathypelagic zone specimen card, Atolla jellyfish

Bathypelagic Zone

The midnight zone, 1,000–4,000 meters. Total darkness — home to bioluminescent life like the Atolla jellyfish.

Next Project Coral Chronicles